2014 Indonesian General Election Using D3.js
I have mentioned previously my primary reason to learn D3.js is for map visualization. I wanted to visualize the data of 2014 Indonesian General Election.
Indonesians are currently enthusiastic for the next 2019 General Election. It will be a rematch for the same presidential candidates. By providing a visualization of the result of the previous election, I hope each candidate and his team can make a campaign plan/strategy based on data.
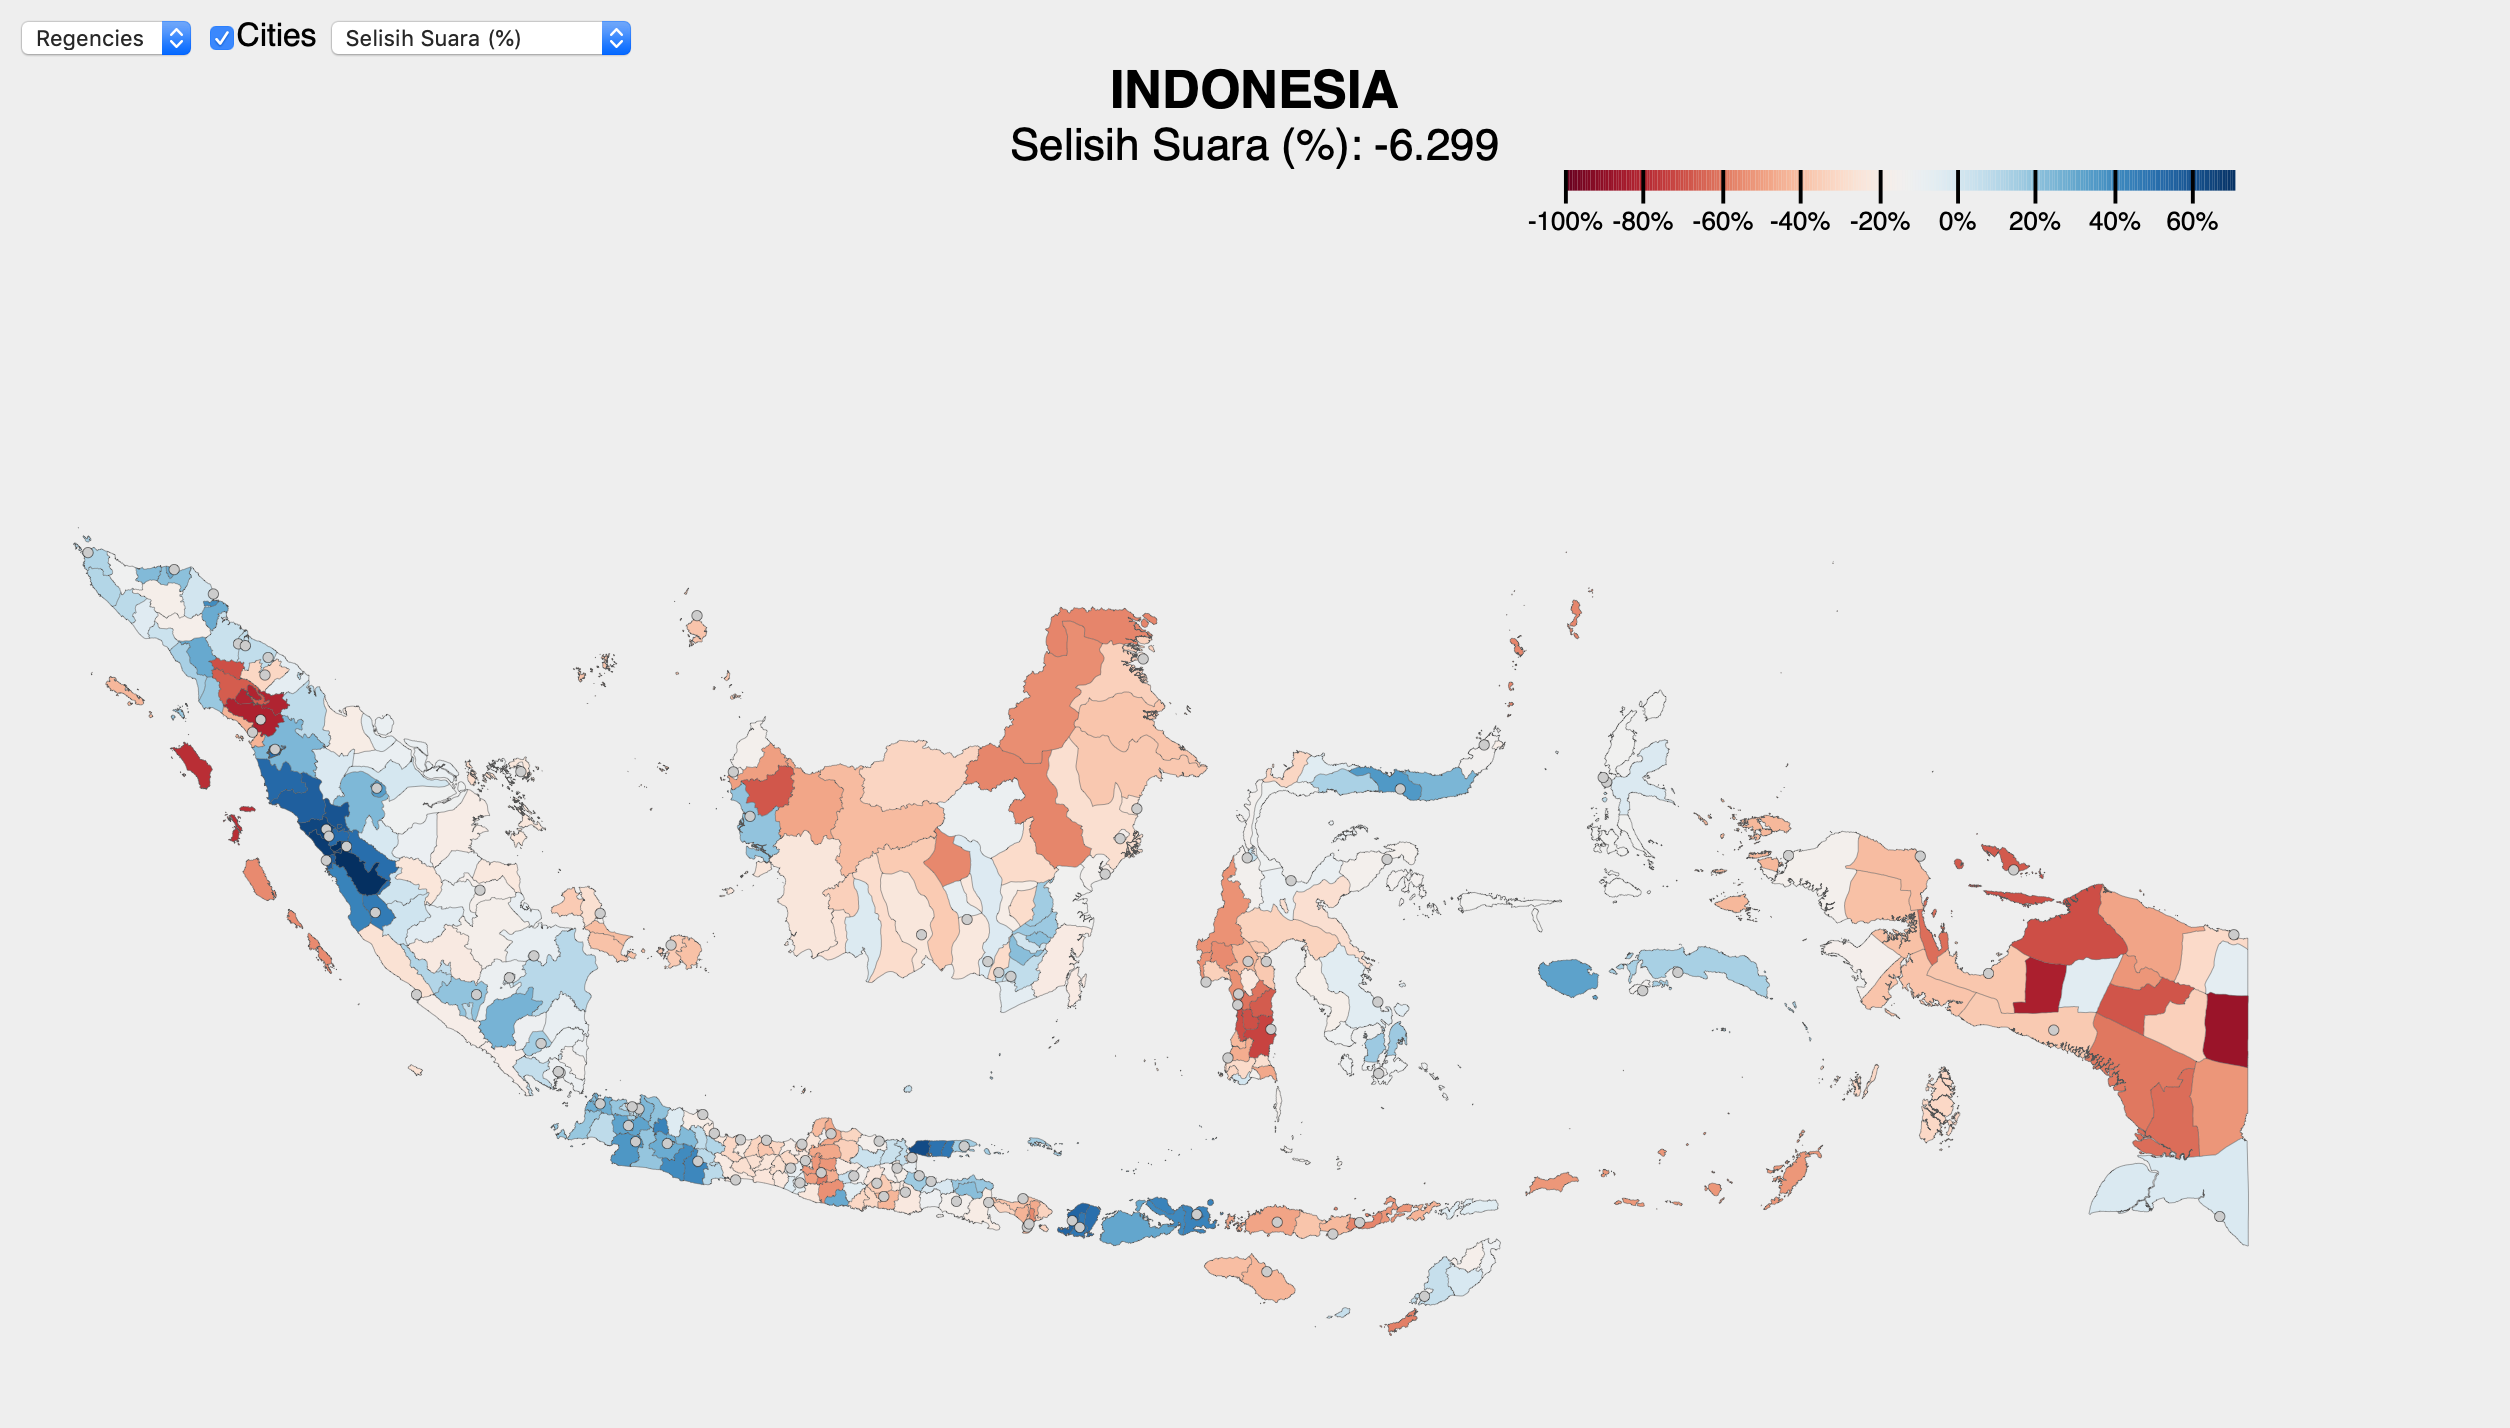
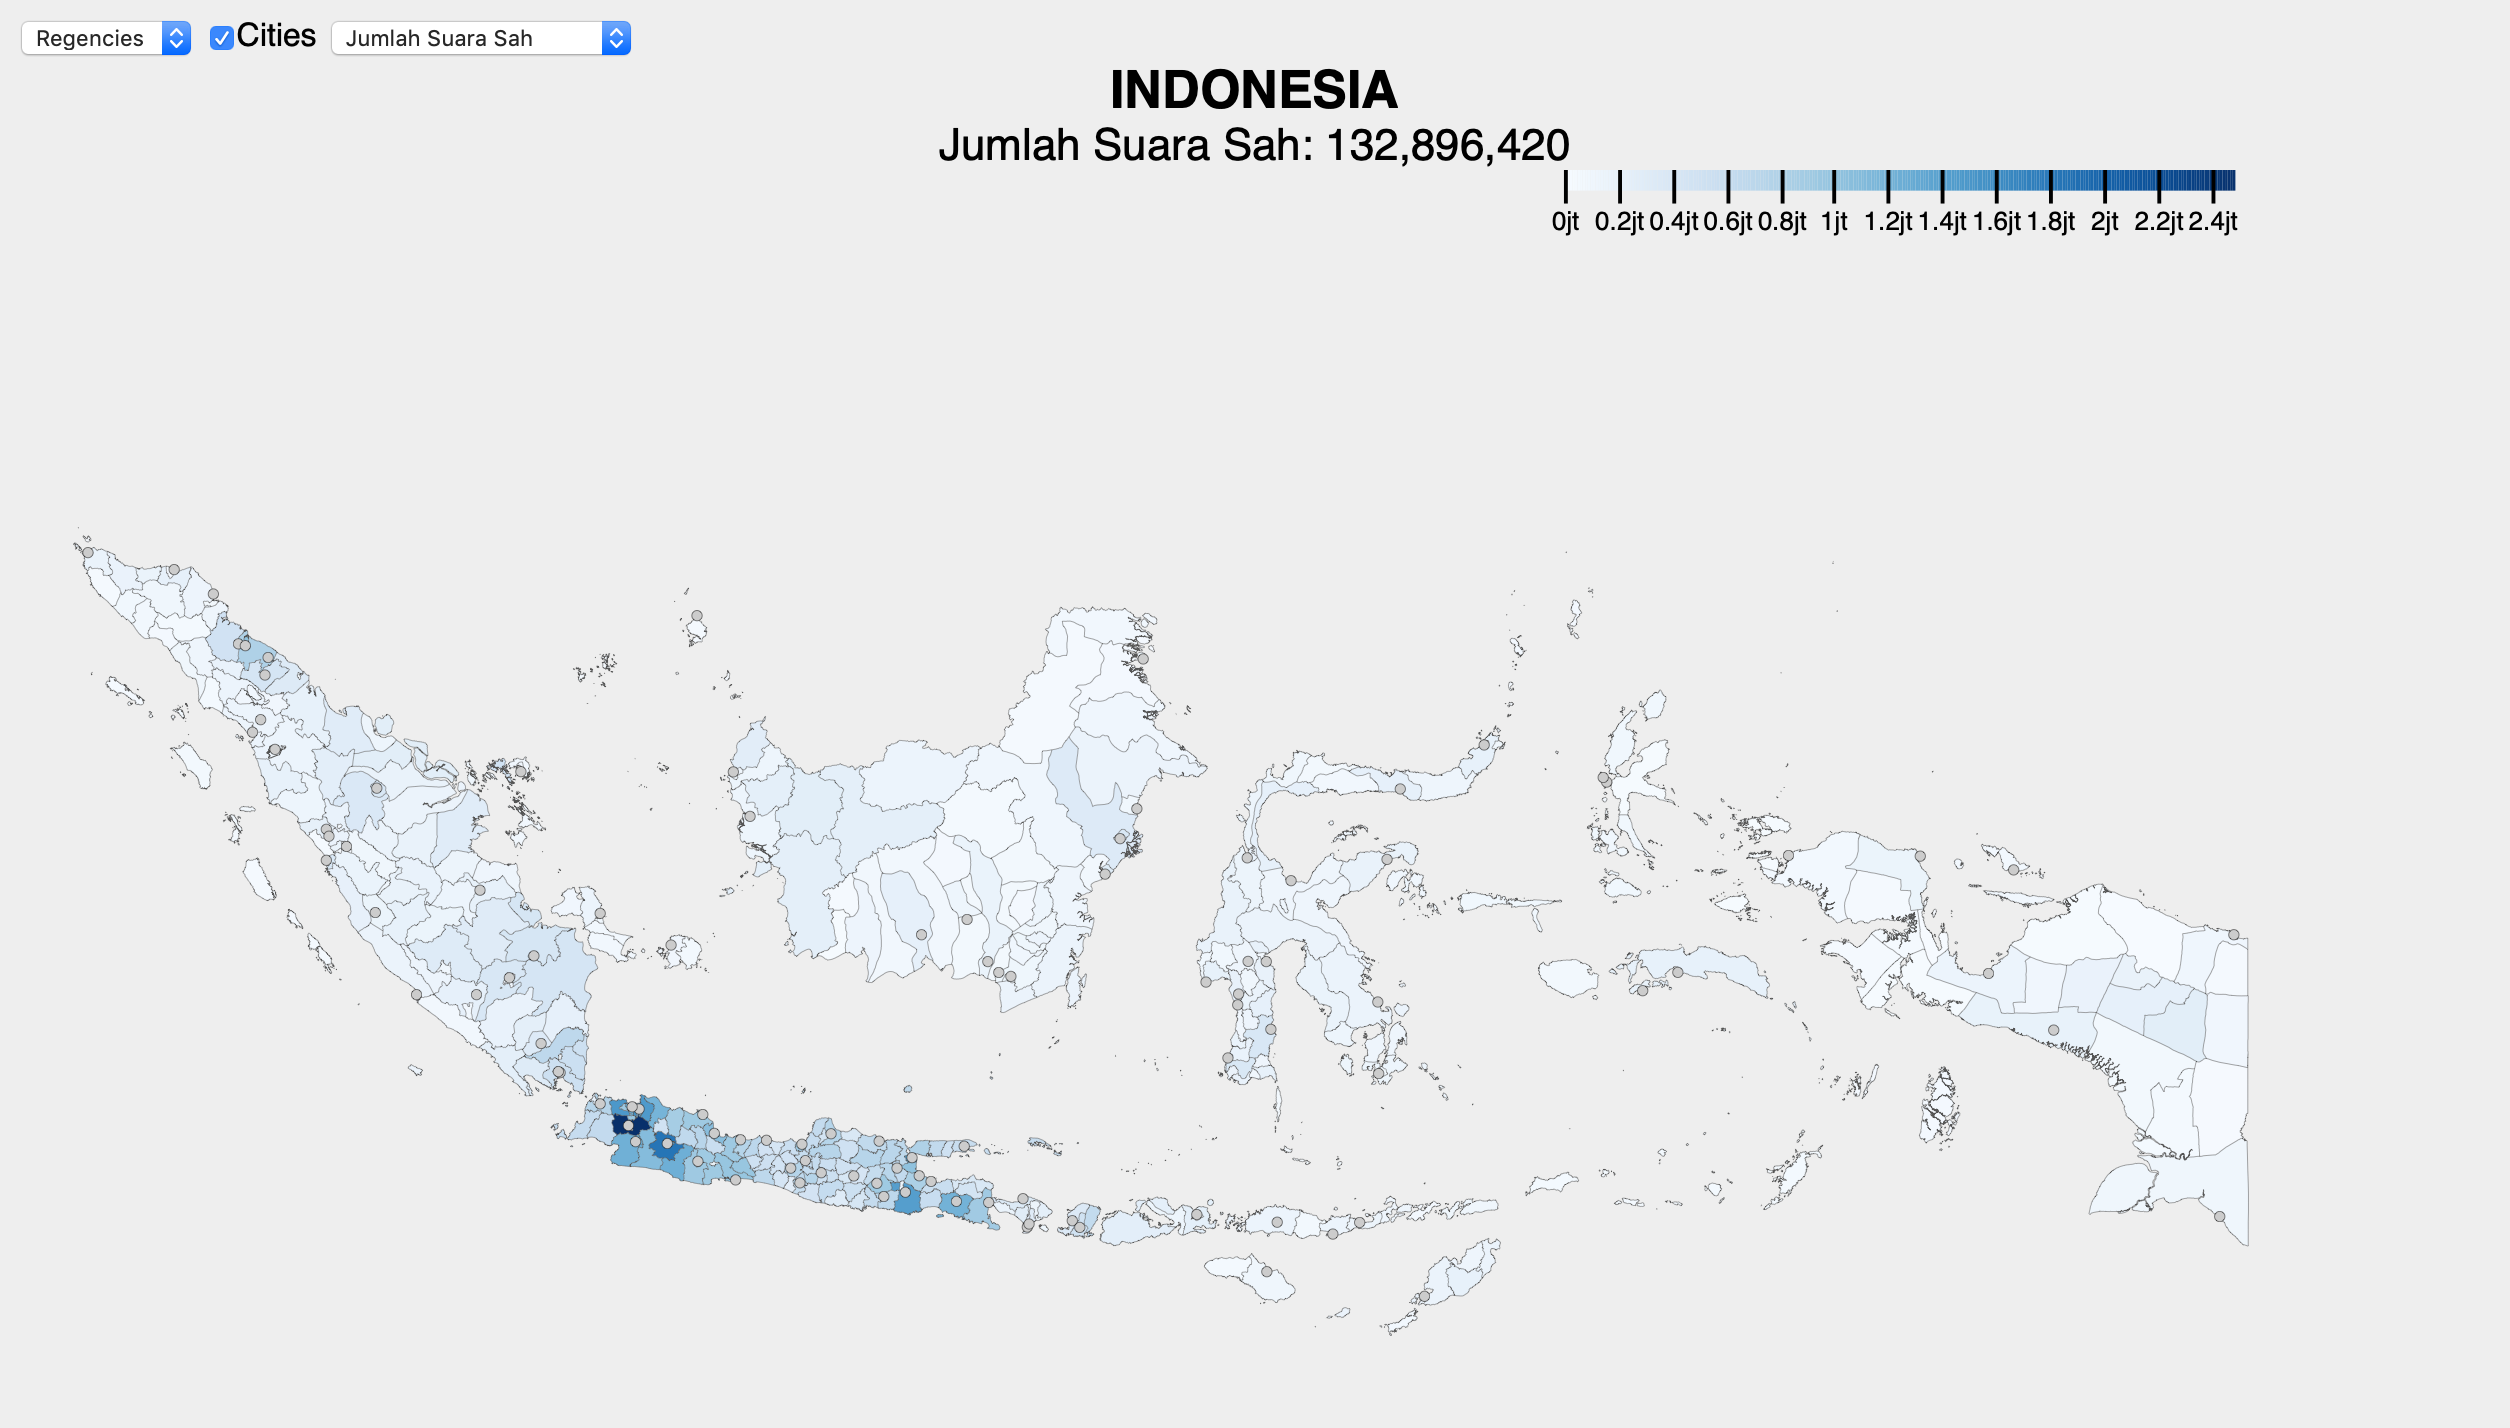
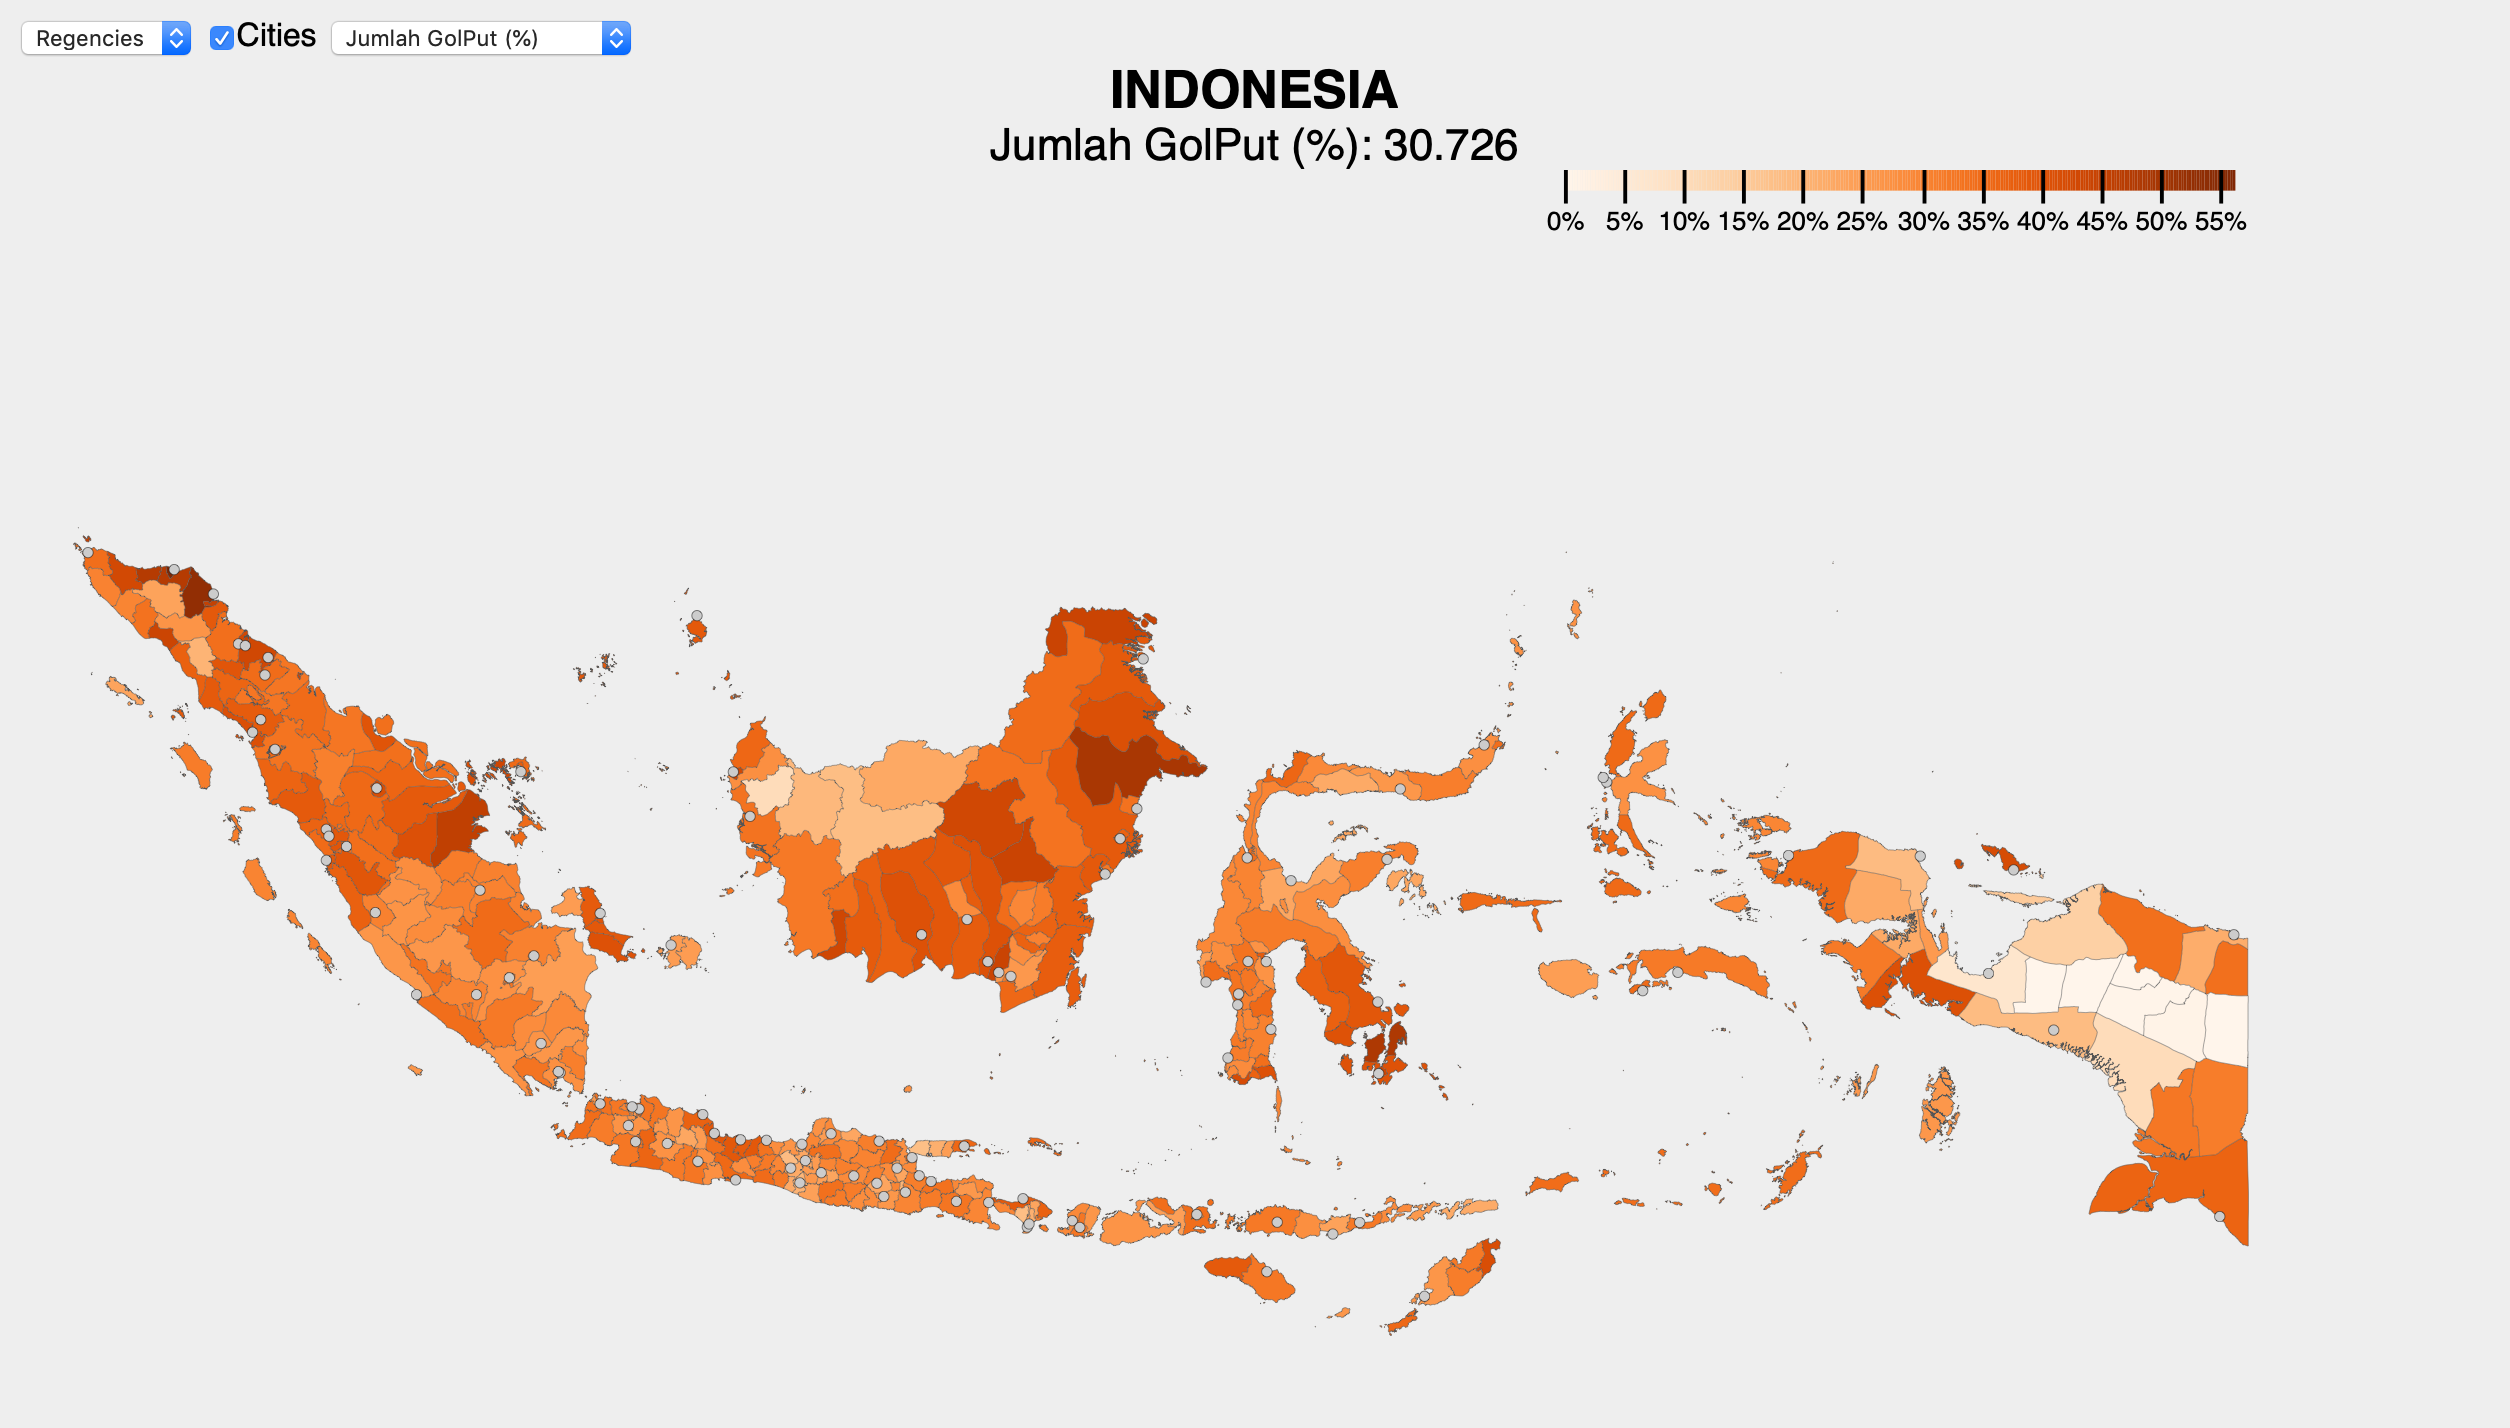
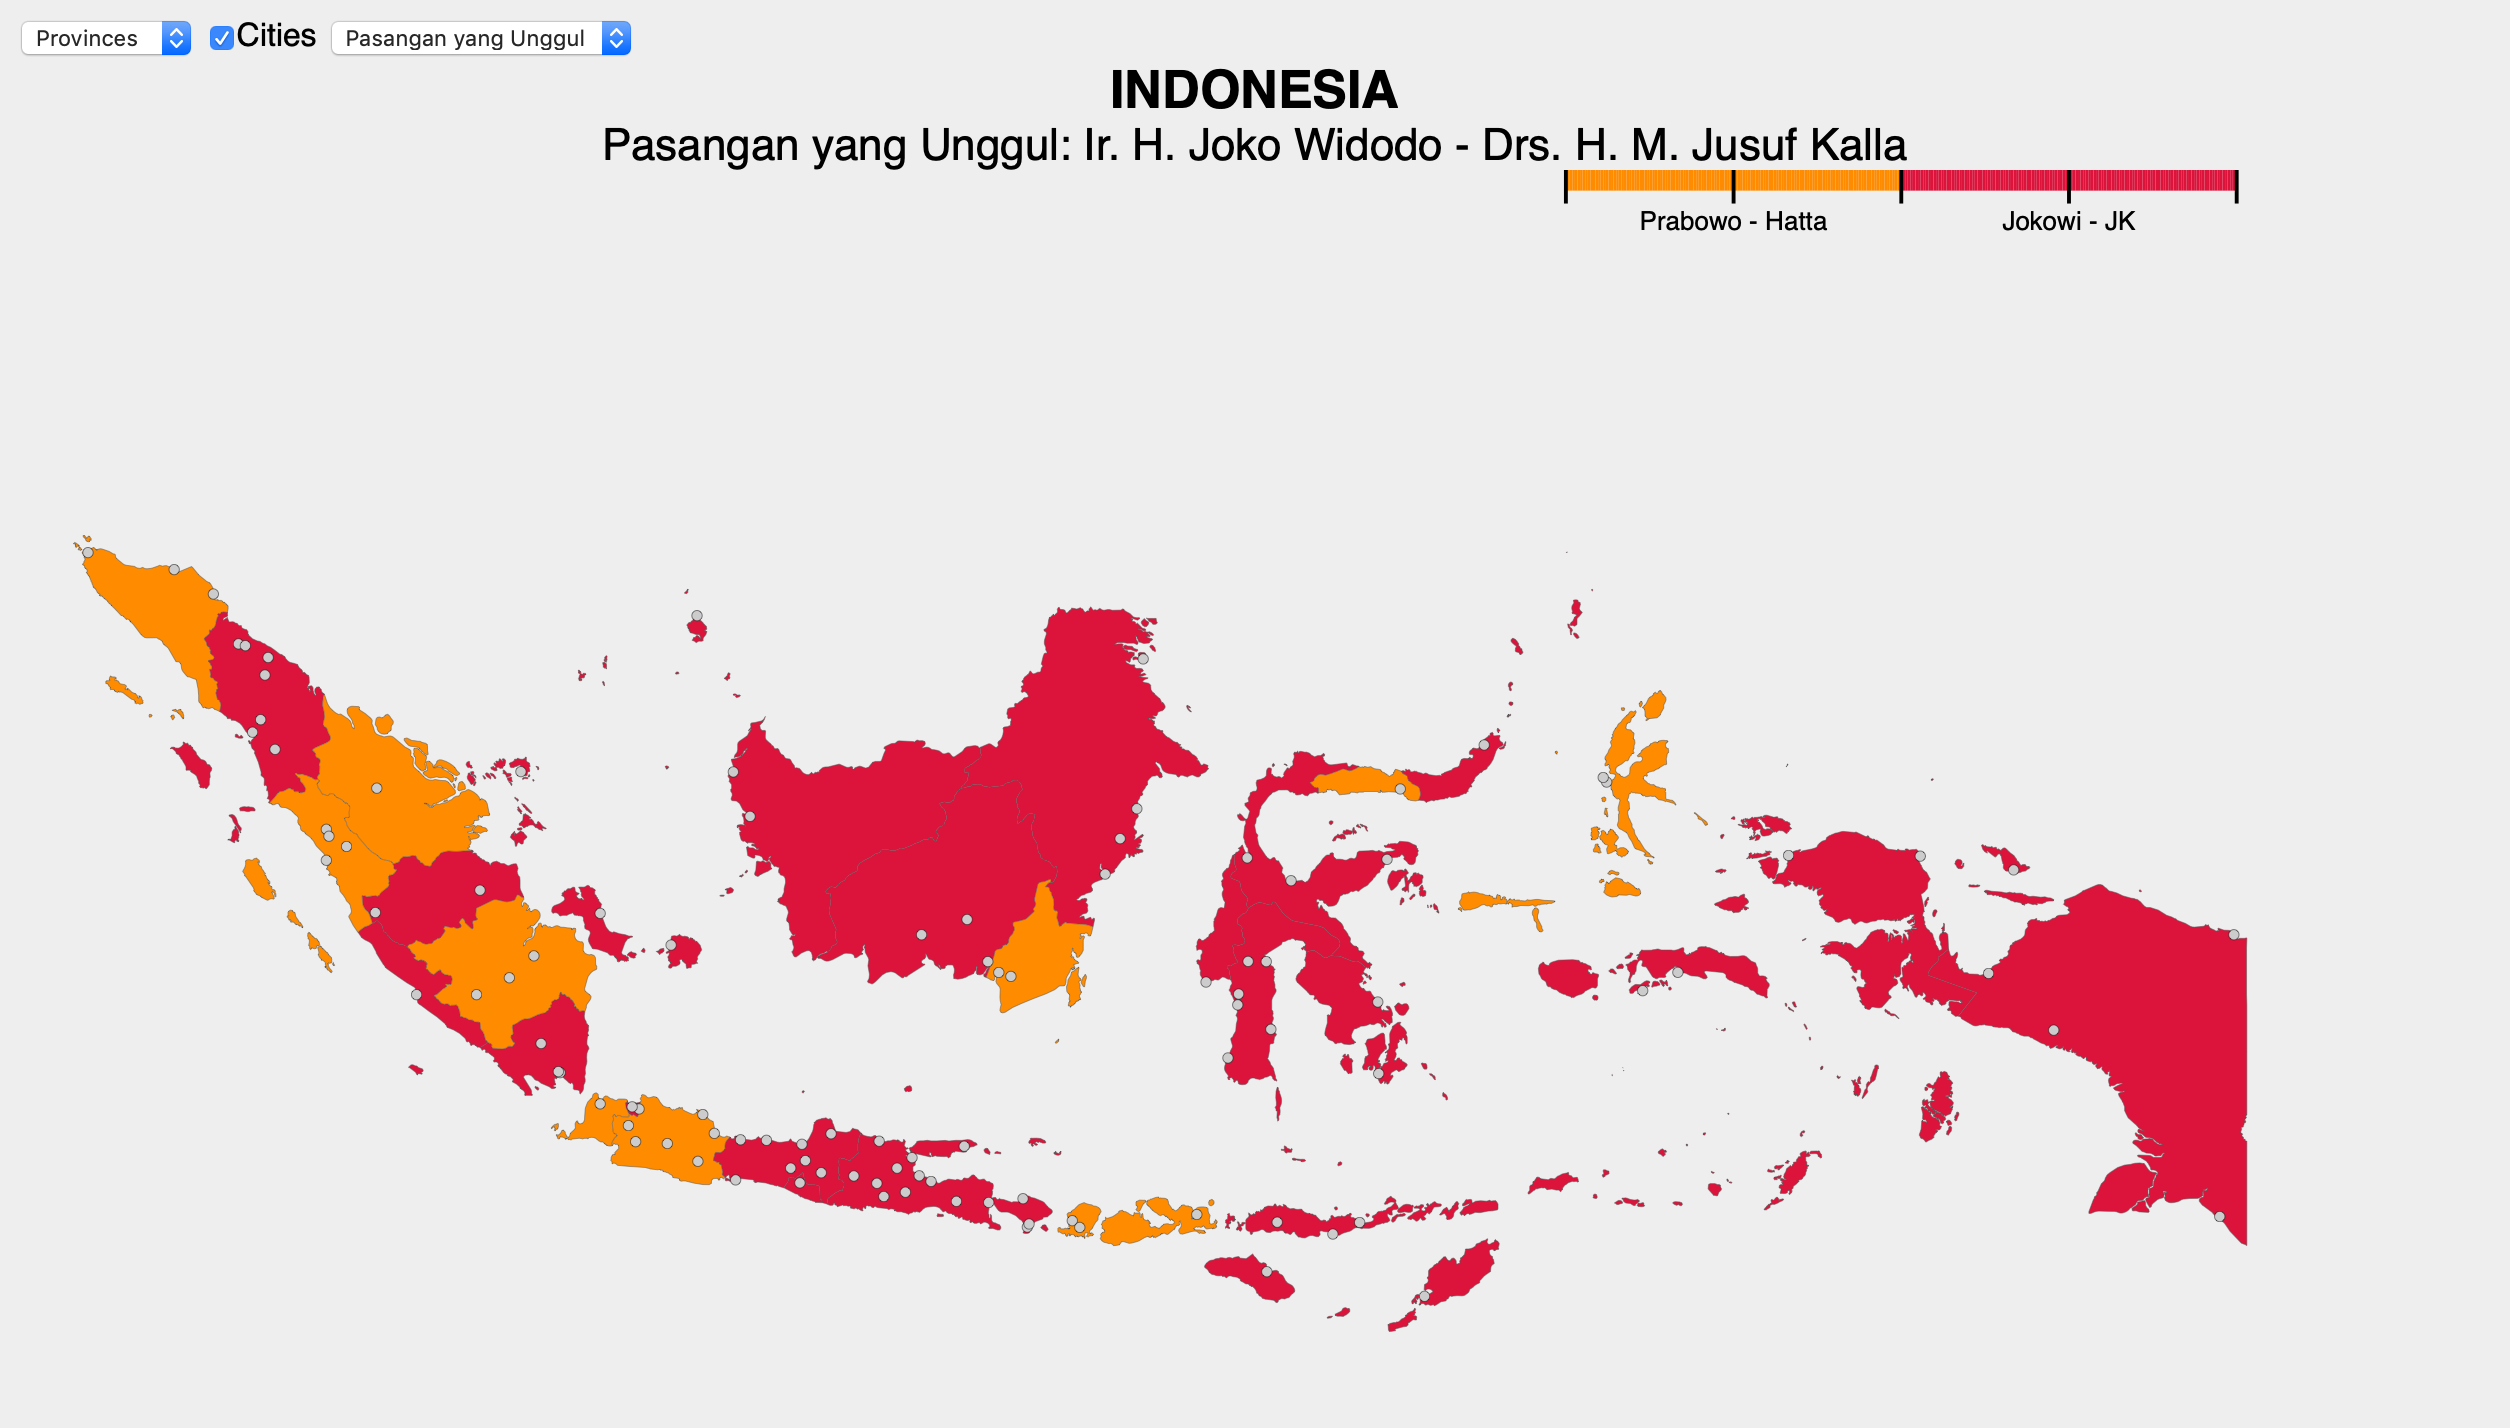
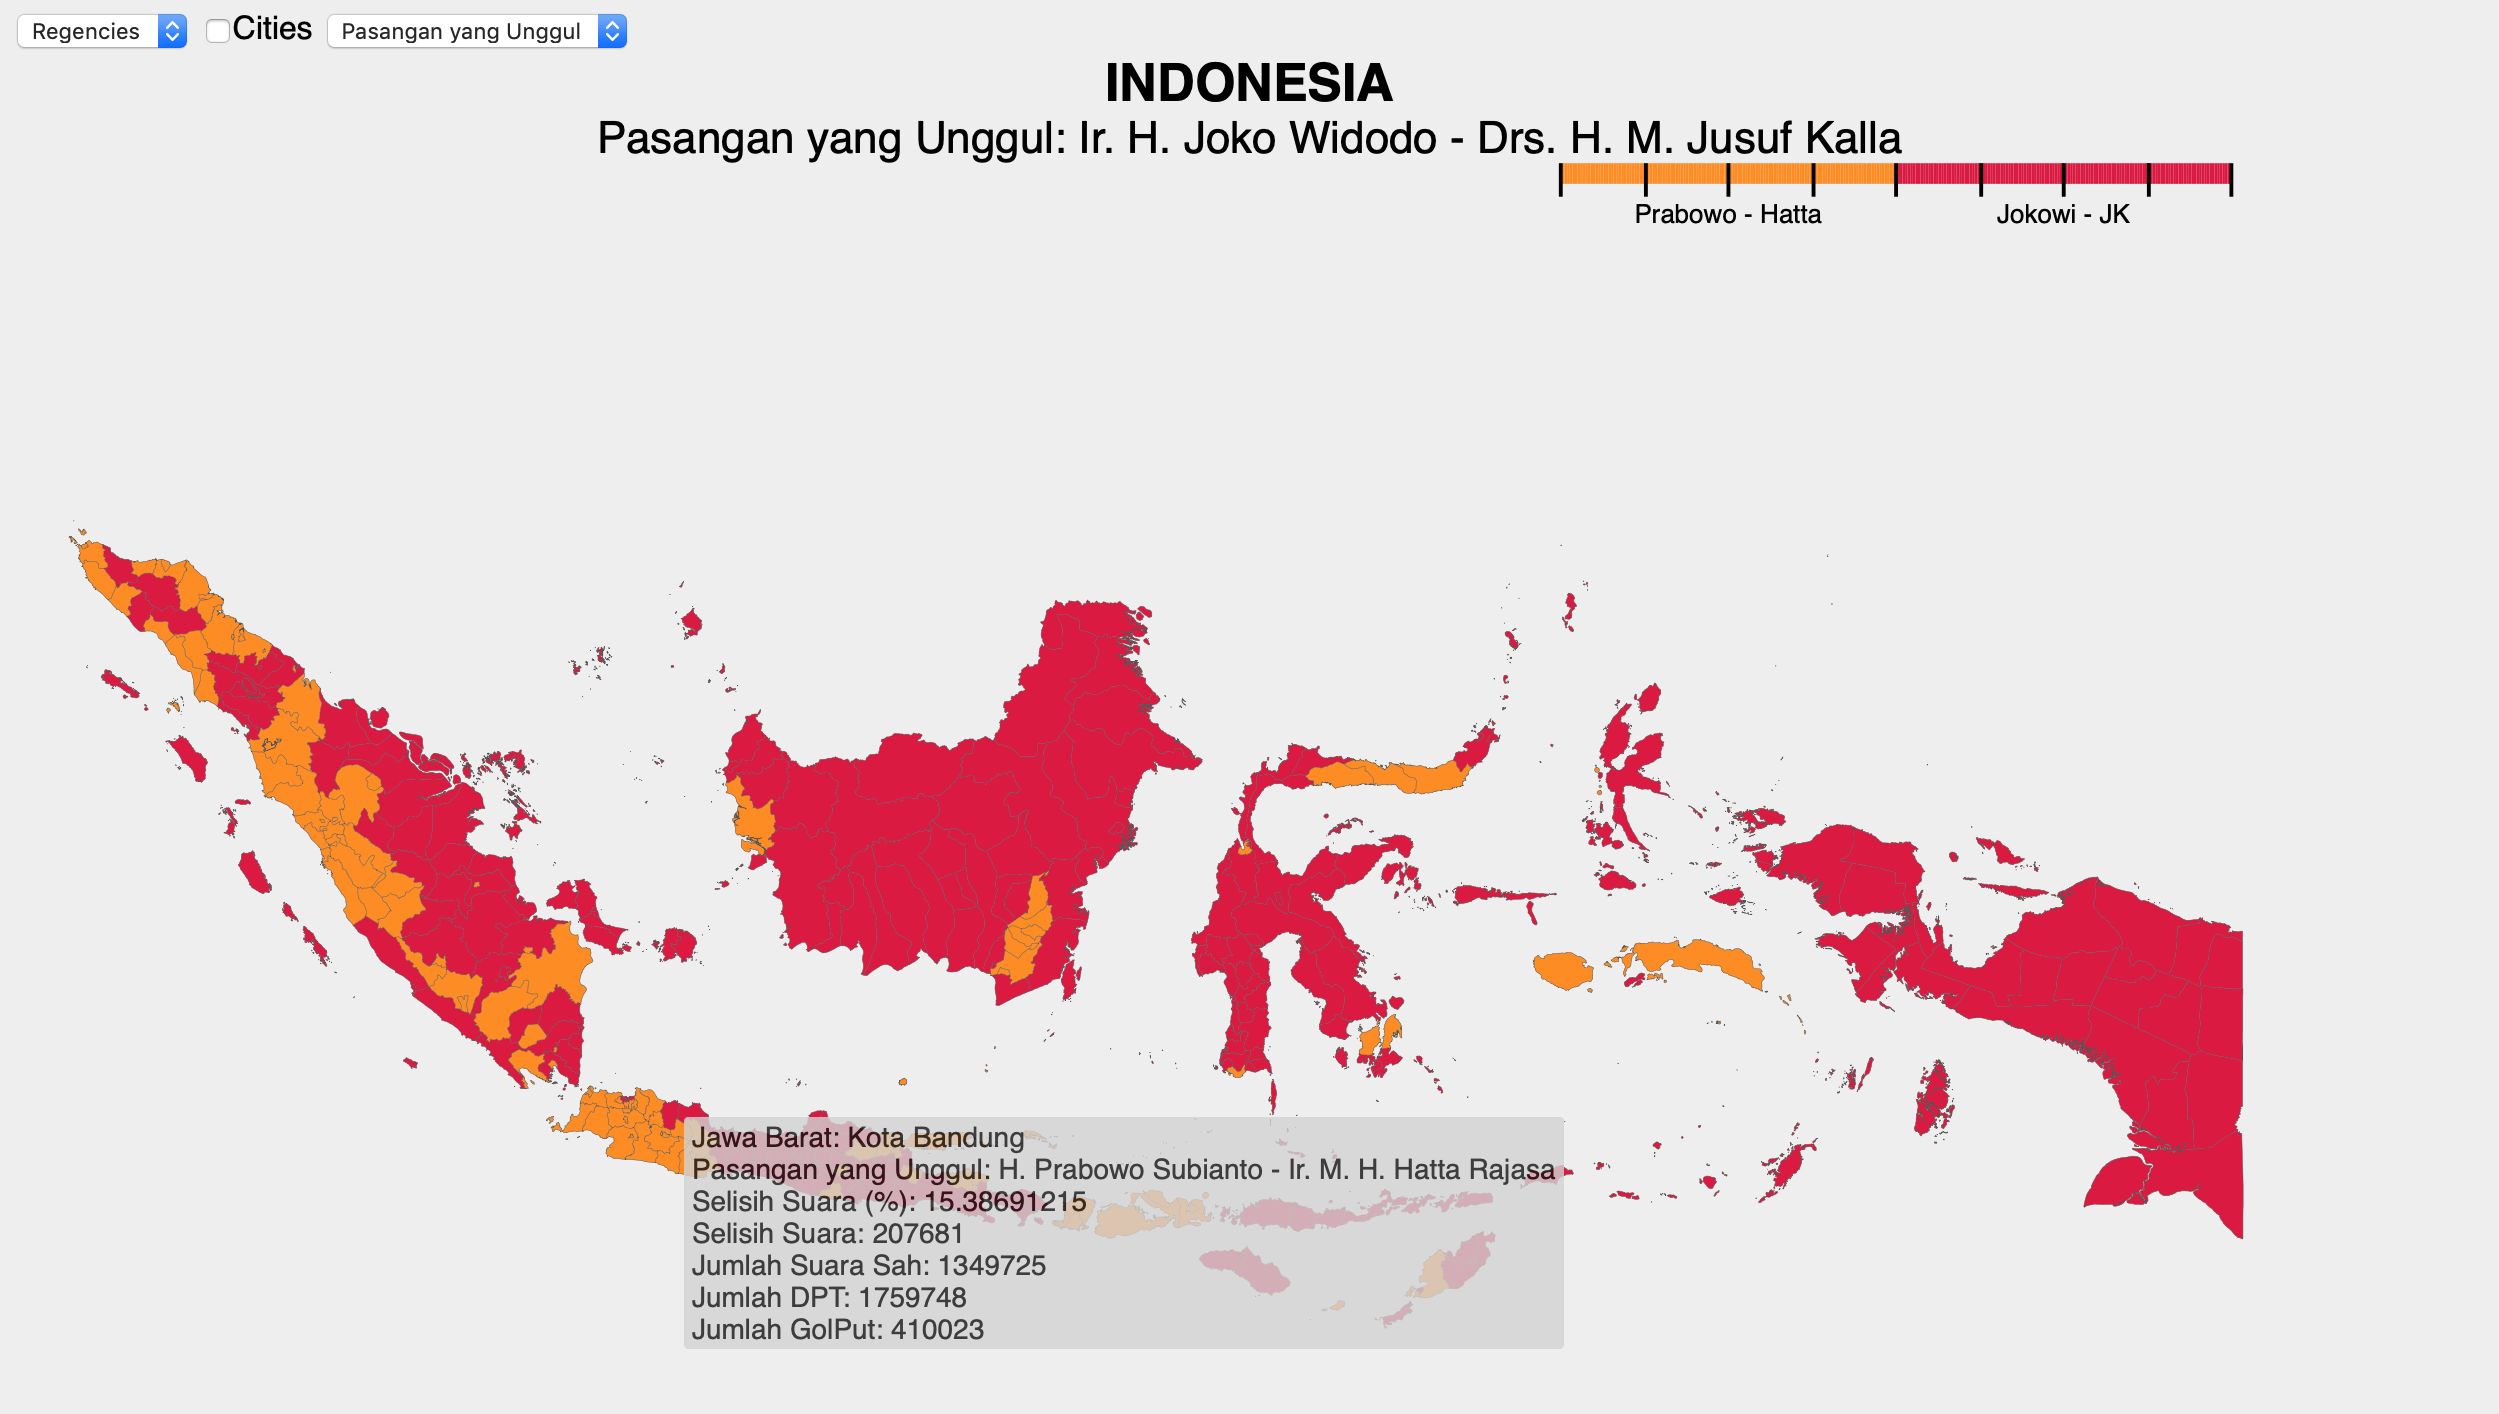
After doing the tinkering, I come with a map of Indonesia with the regions colored according to which candidate who won. The map can be accessed at siriusdely.com/pilu. One functionality available on the map is to choose the visualization based on provinces or districts/cities, as shown in the screenshots below:
The page is hosted and served through Github Page, which code is available at github.com/siriusdely/pilu. The data is taken from the Indonesian General Election Commission’s Official Site. There are two tools used to fetch the data: Cheeriojs & Puppeteerjs. As both names imply, those two are Javascript packages, can be installed using the command: npm install.
Cheerio is what we use to get a specific element from the HTML three being shown on the web browser, much like jQuery. While Puppeteer is what we use to drive the web browser to open a specific web page and perform certain actions on the page. Puppeteer is also usually used for web automated testing, as an alternative to Selenium.
The working script can be seen here, which can be run by using the command: node scraper.js.
Below is the screenshot of other visualization pages available there: